When you click the Preflight command, the Preflight dialog box pops up, allowing you to run a preflight inspection, fix errors in documents, view preflight results, and more. There are three tabs in the Preflight dialog box: Profiles, Results, and Standards.
The Profiles tab
The Profiles tab lists groups of preflight profiles for different inspection criteria. You can expand or collapse a group to show or hide the profiles in the group. A preflight profile may include one or more checks, fixups, or both checks and fixups.
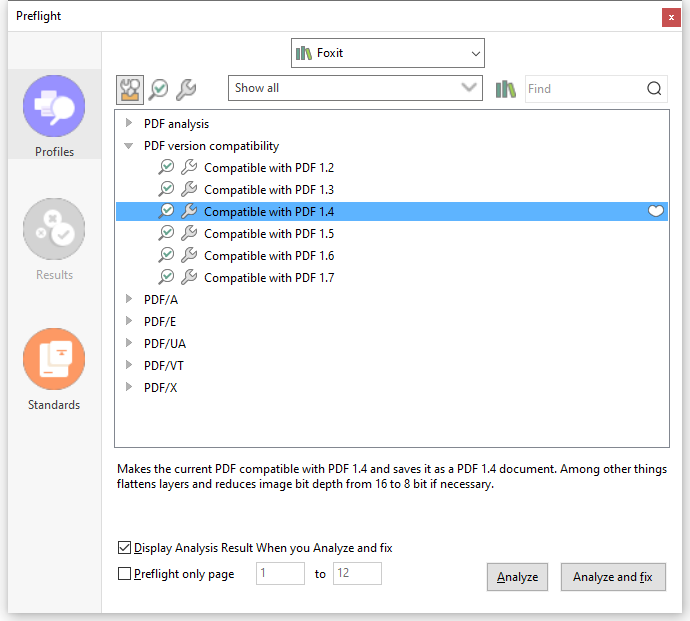
- A preflight profile with available fixups has a filled-in gray wrench icon
 next to it and can correct the related errors in documents; for an outline of a wrench icon
  , no available fixups are associated with the profile. Click on a profile/check/fixup, and the description about it appears in the dialog box.
 - When you select a profile/check/fixup, a white heart icon
 appears next to it. Click on the icon to mark the profile/check/fixup as a favorite, and the icon will change to a filled-in red heart icon
 .
. - Sets of preflight profiles, checks, and fixups are organized in libraries for different workstations, functions, or workflows. At the top of the Preflight dialog box, choose a library to view the set of profiles.
- There are three buttons for you to view profiles, checks, or fixups.
- The Select profiles button
 : click it to show a list of available profiles.
 - The Select single checks button
 : click it to show a list of available checks.
 - The Select single fixups button
 : click it to show a list of available fixups.
- The Select profiles button
- Next to the three buttons is a menu. Click on the menu and select an option as needed to view all associated or your favorite items, or other categories.
- Use the Find box next to the menu to search for a profile/check/fixup in the current library. Click the Search all Libraries button
 to search for a profile/check/fixup in all libraries.
 - Display Analysis Result When you Analyze and fix: With this option selected, if you choose Analyze and fix, the Preflight dialog box will pop up displaying the preflight results in the Results tab after the Analyze and fix process completes. This option is selected by default.
- Preflight only page: Specify a range of pages for the preflight inspection.
- Analyze: Click the button to run the inspection without fixing errors if any.
- Analyze and fix: Click the button to run the inspection and fix errors if any. This button is greyed out or not available when you select a profile without available fixups or a single check.
- Fix: If you select a single fixup, click the button to run the inspection and fix the errors if any.
The Results tab
The Results tab shows the detailed results for the preflight inspection. Different icons appear next to each item for different results:
- The green check mark
 : No problems were found.
 - The red X error icon
 : Errors occurred in the check and you need to correct them before final output.
 - The blue Info icon
 : Informs you that some mismatches were found in the check, but you do not have to correct them before final output.
 - The filled-in gray wrench icon
 : The errors occurred in the check was fixed successfully.
 - The filled-in gray wrench icon with a red X
 : The errors occurred in the check was not fixed successfully.
You can click Create Report… to save the results as a PDF, .xml, .txt, or .html file.
The Standards tab
In the Standards tab, which acts as a wizard, you can see detailed information on PDF/A, PDF/E, or PDF/X standards and follow the onscreen instructions to convert your PDFs to standard-compliant PDF files.